What is a bar graph?
A bar graph is a chart that uses bars to show comparisons between categories of data. It is also useful for comparing facts. The bars provide a visual display for comparing quantities in different categories. Bar graphs help us to see relationships quickly. Another name for a bar graph is a bar chart. (from http://mathgoodies.com)
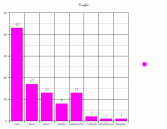
What is a St. Columba Birthday Bar graph?
For this school year, our birthday board was turned into a big bar graph. Each student has his/her birthday on the graph. The "x" axes along the bottom of the graph displays the months of the year. The bar for each month starts with the first birthday of the month to the last birthday of the month. The "y" axes should be numbered, but it is not. How will you be able to find out these numbers?
For more information on bar graphs, click the picture.
A bar graph is a chart that uses bars to show comparisons between categories of data. It is also useful for comparing facts. The bars provide a visual display for comparing quantities in different categories. Bar graphs help us to see relationships quickly. Another name for a bar graph is a bar chart. (from http://mathgoodies.com)
What is a St. Columba Birthday Bar graph?
For this school year, our birthday board was turned into a big bar graph. Each student has his/her birthday on the graph. The "x" axes along the bottom of the graph displays the months of the year. The bar for each month starts with the first birthday of the month to the last birthday of the month. The "y" axes should be numbered, but it is not. How will you be able to find out these numbers?
For more information on bar graphs, click the picture.